Author- Dr. Harshal H. Sabane, M.D.
Professor and Chair, Department of Community Medicine,
S.S.R. Medical College, University of Mauritius, Mauritius.
Introduction:
Evaluating the performance of a screening or diagnostic test is essential in clinical decision-making. Understanding key statistical measures such as sensitivity, specificity, predictive values, likelihood ratios, and diagnostic odds ratios helps determine how accurately a test identifies individuals with or without a disease. This guide breaks down each concept using a simple contingency table and a real-world example, providing clear formulas, calculations, and interpretations to support evidence-based practice.
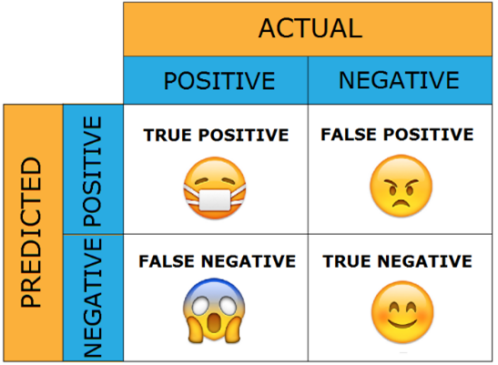
This table represents a contingency table used to evaluate the performance of a screening test.
| Test Result | Disease Present (D⁺) | Disease Absent (D⁻) | Total |
| Test Positive (T⁺) | a (TP) | b (FP) | a + b |
| Test Negative (T⁻) | c (FN) | d (TN) | c + d |
| Total | a + c | b + d | a + b + c + d |
Scenario
A new diagnostic test for detecting Disease X is evaluated on a group of 200 individuals. The results are as follows:
| Test Result | Disease Present (D⁺) | Disease Absent (D⁻) | Total |
| Test Positive (T⁺) | 50 (a) | 30 (b) | 80 (a + b) |
| Test Negative (T⁻) | 10 (c) | 110 (d) | 120 (c + d) |
| Total | 60 (a + c) | 140 (b + d) | 200 (a + b + c + d) |
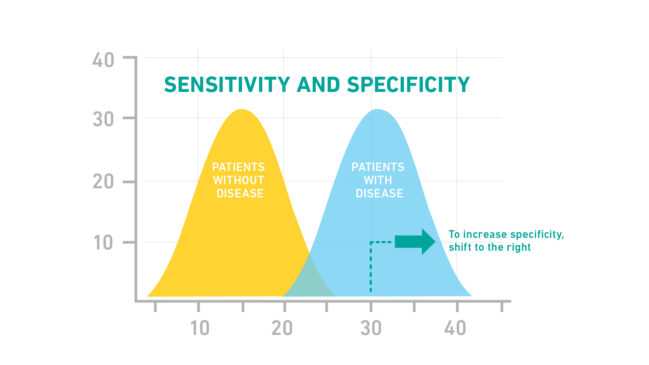
· Sensitivity (True Positive Rate)- Figures A and B
Sensitivity = a / (a + c) = 50 / (50 + 10) = 50 / 60 = 0.833 (83.3%)
Interpretation: This means that the test correctly identifies 83.3% of individuals with the disease.
· Specificity (True Negative Rate)- Figures A and B
Specificity = d / (b + d) = 110 / (30 + 110) = 110 / 140 = 0.786 (78.6%)
Interpretation: This means that the test correctly identifies 78.6% of individuals without the disease.
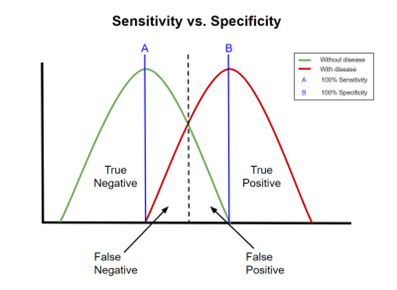
(A)
(B)
Figures A and B- Sensitivity versus Specificity
· Positive Predictive Value (PPV)
PPV = a / (a + b) = 50 / (50 + 30) = 50 / 80 = 0.625 (62.5%)
Interpretation: This means that if a person tests positive, there is a 62.5% probability they actually have the disease.
· Negative Predictive Value (NPV)
NPV = d / (c + d) = 110 / (10 + 110) = 110 / 120 = 0.917 (91.7%)
Interpretation: This means that if a person tests negative, there is a 91.7% probability they do not have the disease.
· Accuracy
Accuracy = (a + d) / (a + b + c + d) = (50 + 110) / 200 = 160 / 200 = 0.8 (80%)
Interpretation: This means that the test correctly classifies 80% of the individuals.
For all the metrics till now, the results can be classified as follows:
|
Value Range |
Interpretation |
| > 90% | Excellent |
| 80 – 90% | Good |
| 70 – 80% | Moderate |
| < 70% | Poor |
· False Positive Rate (FPR)
FPR = b / (b + d) = 30 / (30 + 110) = 30 / 140 = 0.214 (21.4%)
Interpretation: This means that 21.4% of individuals without the disease were incorrectly identified as positive.
· False Negative Rate (FNR)
FNR = c / (a + c) = 10 / (50 + 10) = 10 / 60 = 0.167 (16.7%)
Interpretation: This means that 16.7% of individuals with the disease were incorrectly identified as negative.
Interpreting False Rates (FPER and FNER)
| Value Range | Interpretation |
| < 5% | Low |
| 5 – 10% | Acceptable |
| > 10% | High |
· Positive Likelihood Ratio (LR⁺)
LR⁺ = Sensitivity / (1 – Specificity) = 0.833 / (1 – 0.786) = 0.833 / 0.214 = 3.89
Interpretation: A positive test result is 3.89 times more likely in a diseased individual compared to a non-diseased individual.
· Negative Likelihood Ratio (LR⁻)
LR⁻ = (1 – Sensitivity) / Specificity = (1 – 0.833) / 0.786 = 0.167 / 0.786 = 0.21
Interpretation: A negative test result is 0.21 times as likely in a diseased individual compared to a non-diseased individual.
Interpreting Likelihood Ratios (LR⁺ and LR⁻)
Likelihood Ratios (LR) help assess the diagnostic value of a test result. They indicate how much a test result changes the probability of having a disease.
Positive Likelihood Ratio (LR⁺) Interpretation
Formula: LR⁺ = Sensitivity / (1 – Specificity)
| LR⁺ Value | Interpretation |
| > 10 | Strong evidence to rule in disease (highly useful test) |
| 5 – 10 | Moderate increase in the likelihood of disease |
| 2 – 5 | Small increase in the likelihood of disease |
| 1 – 2 | Minimal increase (not clinically useful) |
| = 1 | No diagnostic value (same as random chance) |
Negative Likelihood Ratio (LR⁻) Interpretation
Formula: LR⁻ = (1 – Sensitivity) / Specificity
| LR⁻ Value | Interpretation |
| < 0.1 | Strong evidence to rule out disease |
| 0.1 – 0.2 | Moderate decrease in the likelihood of disease |
| 0.2 – 0.5 | Small decrease in the likelihood of disease |
| 0.5 – 1 | Minimal decrease (not clinically useful) |
| = 1 | No diagnostic value (same as random chance) |
Summary of Good LR Values
- Ideal LR⁺: Greater than 10 (Strong evidence to rule in disease)
• Ideal LR⁻: Less than 0.1 (Strong evidence to rule out disease)
· Diagnostic Odds Ratio (DOR)
DOR = LR⁺ / LR⁻ = 3.89 / 0.21 = 18.52
Interpretation: The odds of the test correctly distinguishing between diseased and non-diseased individuals is 18.52 times higher.
Interpreting DOR
- A higher DOR indicates better test performance.
• It compares the odds of the test being correct versus being incorrect.
• Unlike sensitivity and specificity, the DOR remains stable across different prevalence rates. - Ideal DOR: Greater than 100 (Excellent test)
• DOR between 25 – 100: Strong test with high reliability
• DOR close to 1: Poor test, not useful
• DOR < 1: Test is worse than random chance, possibly flawed